Comparable Properties Methodology: G1 Parcel Research
How to Build the Comparable-Properties Exhibit That Proves Selective Enforcement — The Step-by-Step Research Methodology
The previous posts in this series established two facts. First, the regulatory framework supports agricultural classification on land with seasonal wetness, dwellings, and all the other characteristics the Property Appraiser cited to deny our parcel. Second, the denial costs roughly $5,600 per year — a 1,007-fold differential compared to the adjacent approved property.
This post shows how to prove it. The comparable-properties exhibit — Tab F in the evidence binder from Post 6— is the exhibit that forces the magistrate to confront the question the appraiser cannot answer: why were those parcels approved and yours denied? This post walks the research methodology step by step, using our own 33-parcel analysis as the working example, so you can replicate it for your property.
This is Post 10 of The Denied G1 Series— a twelve-post field guide built from inside the fight.
Quick Answer
How do you build a comparable-properties exhibit for a VAB hearing?
Three data layers, cross-referenced. Layer 1: the Property Appraiser’s plat map or GIS system, which identifies every G1-classified parcel within your radius and shows their classification codes, assessed values, and parcel boundaries. Layer 2: the National Wetlands Inventory overlay, which shows whether approved G1 parcels sit on federally mapped wetlands — the same condition the appraiser cited to deny yours. Layer 3: current satellite imagery from the Property Appraiser’s base map or Google Earth, which reveals whether those “grazing” parcels actually show cleared grazing land or heavy forestation with no visible agricultural activity. In our case, 33 G1 parcels within a half-mile radius, and only 2 of approximately 10–12 G1 Grazing parcels showed actual cleared grazing on satellite imagery. The rest were heavily forested. The comparison table built from these three layers is Tab F in the evidence binder.
The Three Data Layers
The comparable-properties exhibit works because it cross-references three independent, publicly available data sources. Each layer answers a different question, and the three together tell a story the appraiser’s file does not address.
No single layer makes the argument alone. The plat map shows the approvals. The NWI overlay shows the wetlands. The satellite imagery shows the actual land conditions. Together, they demonstrate that the standard applied to deny your parcel was not applied to the parcels that were approved. That is the selective enforcement argument, built entirely from public records.
Step-by-Step Methodology
The following process produces the comparable-properties exhibit for Tab F of the evidence binder. In our case, the research took approximately two to three hours using publicly available online tools. No GIS software is required. No Freedom of Information requests. Everything is accessible through a web browser.
What Our 33-Parcel Analysis Found
The methodology above produced the following results in our case. These are the numbers behind the argument — 33 approved parcels, one denied parcel, and no rational basis for the differential.
The vast majority of properties granted G1 “grazing” status within a half-mile of our property are not, in fact, used for grazing. The property with the documented livestock operation, the visible infrastructure, and the five years of commercial activity is the one that was denied.
The Satellite Imagery Evidence
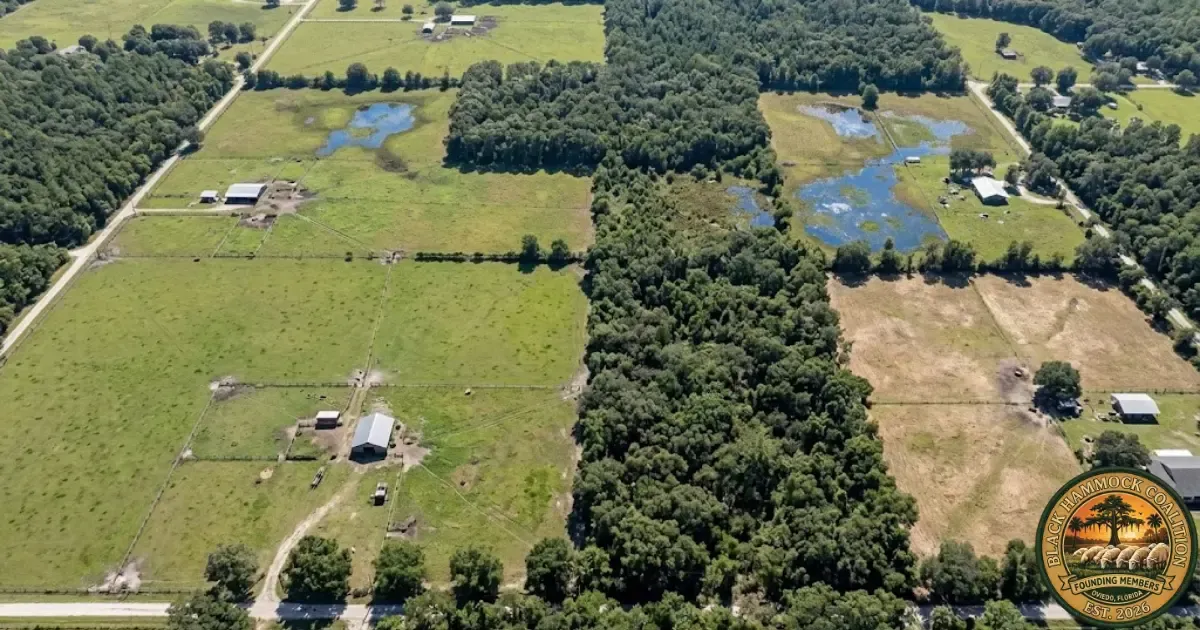
Step 4 is where the exhibit becomes visual. When the magistrate can see the satellite imagery side by side — the forested parcels with G1 Grazing classification next to the active pasture that was denied — the inconsistency is self-evident.
In our analysis using the SCPA Base Map Gallery 2025, the G1 Grazing parcels displayed dark blue/green coloring consistent with mature forest cover — dense tree canopy with no visible clearing, no pasture, no fencing, and no evidence of livestock or agricultural activity. These are parcels classified as “grazing land” that show no grazing. Our parcel — with livestock visible on the same satellite imagery, cleared pasture, fencing, and agricultural structures — was classified residential and denied.
When you run this analysis for your property, screenshot the approved parcels and your denied parcel from the same satellite source, at the same zoom level, taken from the same date. Print them side by side in Tab F. Label each screenshot with the parcel ID, classification code, and assessed value. The visual comparison speaks for itself.
The Argument This Exhibit Makes
The comparable-properties exhibit does not challenge the classification criteria. It challenges the application of those criteria. This is an important distinction. The appeal does not argue that the standards are wrong. It argues that the standards are not being applied uniformly. The relief sought is consistent treatment under the existing standard — not a change to the standard itself.
Florida Statute 193.461 requires uniform application. The Florida Constitution’s equal protection guarantee requires that similarly situated taxpayers receive similar treatment. When the comparison table shows 33 approved parcels and 1 denied parcel — with the denied parcel showing more agricultural activity than any of the approved ones — the appraiser must explain the differential. The burden shifts. That is the purpose of Tab F.
Assembling Tab F for the Evidence Binder
Tab F in the evidence binder from Post 6 should contain the following items, in order.
Item 1 — Summary statement. One page. States the finding: X parcels carry G1 classification within a [distance] radius. The denied parcel has documented agricultural activity exceeding all comparables. The denial constitutes selective enforcement.
Item 2 — Comparison table. The table built in Step 6 above. One row per comparable, your denied parcel as the reference row at the bottom. Columns: parcel ID, classification, assessed value, annual taxes, NWI wetlands status, satellite description, assessment multiple.
Item 3 — Plat map printout. The Property Appraiser’s plat map or GIS view showing all G1 parcels within the radius, with your parcel marked. Annotate the legend if needed.
Item 4 — NWI overlay printout. The NWI Wetlands Mapper view of the same area, showing which G1 parcels sit on federally mapped wetlands.
Item 5 — Satellite imagery screenshots. Side-by-side comparisons of approved forested parcels and your denied parcel, all from the same satellite source and date. Labeled with parcel ID, classification code, and assessed value.
What the Series Looks at Next
The next post in this series, publishing July 2, covers what happens at the magistrate hearing itself — the room, the procedure, the time limits, how evidence is presented, how the magistrate asks questions, and how to structure the ten to fifteen minutes you have to make your case. The hearing preparation guide built from our own experience walking into the room with the binder.
Frequently Asked Questions
How far should I search for comparable properties?
A half-mile radius is a reasonable starting point for most parcels in suburban-rural transitional areas like east Seminole County. If your area is more sparsely parceled, expand to one mile. The goal is to identify enough G1 comparables to establish a pattern of approval. In our case, a half-mile radius produced 33 G1 parcels, which was more than sufficient. Even five or six well-documented comparables can establish selective enforcement if the conditions are similar.
Where do I access the National Wetlands Inventory?
The NWI Wetlands Mapper is a free, publicly accessible tool maintained by the U.S. Fish and Wildlife Service at fws.gov/program/national-wetlands-inventory. Navigate to your area using the address search. The mapper displays wetlands classifications including Freshwater Emergent Wetlands (typically bright green) and Freshwater Forested Shrub (typically darker green). You can overlay this data with the Property Appraiser’s parcel boundaries by toggling between the two tools.
What if my county does not have an online GIS map?
Most Florida counties offer some form of online parcel search, but the GIS tools vary widely. If your county does not have an interactive map, you can request plat maps from the Property Appraiser’s office directly. You can also use the county’s Record Search to look up individual parcels by address or parcel ID and manually identify G1-classified properties near yours. Google Earth can serve as a substitute for the Property Appraiser’s satellite imagery layer.
How many comparable properties do I need?
There is no statutory minimum. A single well-documented comparable — an adjacent property with identical conditions that carries the classification you were denied — can be powerful. Five to ten comparables with assessed values, wetlands data, and satellite imagery establish a clear pattern. Our 33-parcel dataset was unusually comprehensive, but the core argument could have been made with the adjacent property alone. Quality of documentation matters more than quantity.
Can I use this methodology in counties outside Seminole?
Yes. The three data layers are available statewide. Every Florida county Property Appraiser maintains public records accessible through their website. The National Wetlands Inventory covers the entire United States. Google Earth provides satellite imagery for any location. The classification codes may use different naming conventions in other counties, but the underlying data structure — parcel records, assessed values, classification codes, and wetlands mapping — is consistent across Florida.
Sources & References
Every data source in this piece is publicly accessible. The links below open the tools and records directly.
Property Appraiser records
Seminole County Property Appraiser— Record Search, GIS plat maps, Base Map Gallery 2025. All parcel data, classification codes, assessed values, and satellite imagery referenced in this post.
Federal wetlands mapping
U.S. Fish and Wildlife Service — National Wetlands Inventory— Wetlands Mapper tool for federal wetlands classification data.
Florida statutes
Florida Statute § 193.461— Agricultural lands; classification and assessment. Requires uniform application of classification standards.
Series cross-references
Post 6: How to Build the Evidence Binder— Tab F structure and placement.
Post 7: The Wetlands Argument Dismantled— NWI overlay context and the regulatory framework for wetlands and classification.
Post 9: The Tax Math Behind Every Denial— The assessment differential that the comparable-properties data populates.
